Our client
CBRE
As the world's largest commercial real estate services companies by revenue, CBRE provides property and facilities management, leasing, brokerage, appraisal and valuation, asset management, financing, and market research services from more than 400 offices worldwide, and manages 1.5 billion sq. ft. of commercial space for third-party owners and occupants.
Problem: CBRE identified a need for their executives to see necessary performance indicators in a more timely manner. As it was, they had to sift through hundreds of generated reports to find something specific and had no way to sum them up without a large amount of effort.
Solution: Create a native mobile experience that allows for quick access to timely views of key performance indicators. The dashboard would provide executives with an understandable view of their organizations health and performance at all times.
My Contributions: Dashboard and revenue comparison designs, client presentation design and copy, video and music assistance.
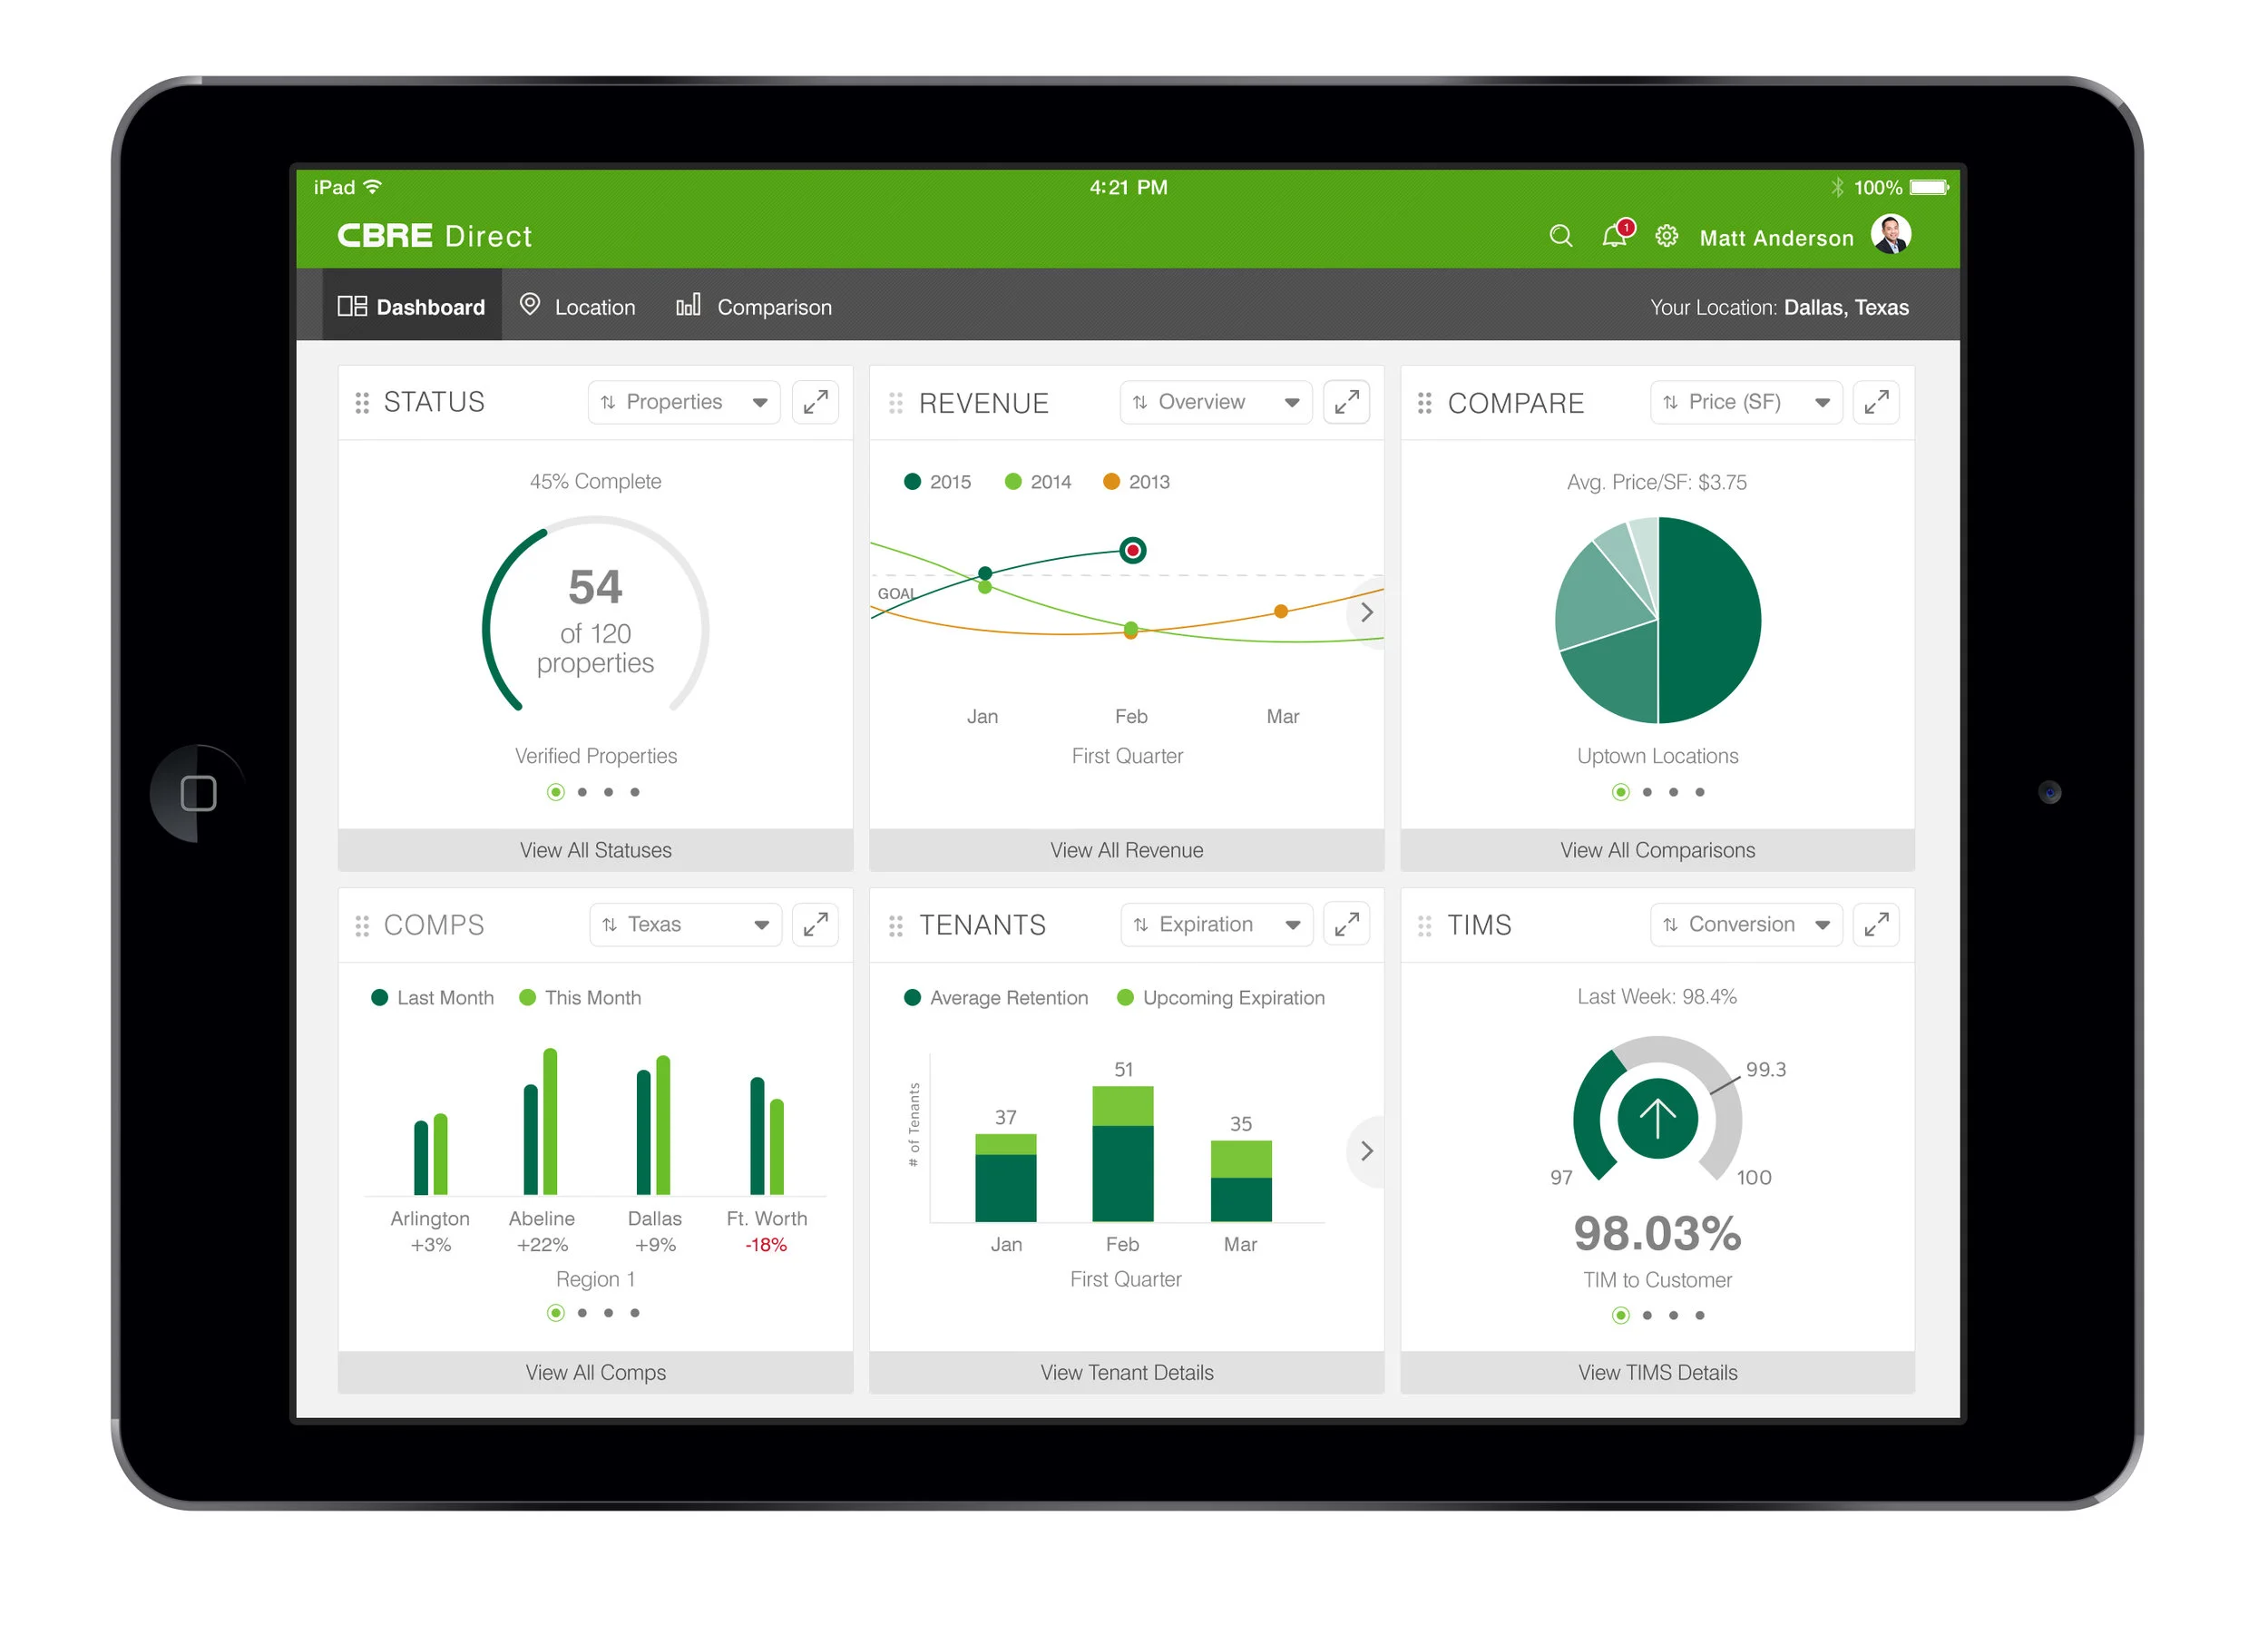


We delivered useful analytics that were easily scannable. They were multi-dimensional so that executives could see more high level analytics if they were interested in that area of focus. Graphs were interactive - a user could dive deeper into a certain area to get detailed information and make comparisons when and where they needed.